
Introducing Lynq Dashboard
Lynq Dashboard is now available. It solves recurring inconveniences when operating Lynq Operator, especially around checking the current state, which previously required combining kubectl and jq every time.
This post describes what problems the dashboard solves and how it works.
The Problems
Understanding Resource Relationships
Lynq has a hierarchical structure: Hub → Form → Node. But with kubectl, you can't see this relationship at once.
bash
# Hub list
kubectl get lynqhubs -A

# Find Forms referencing this Hub
kubectl get lynqforms -A -o json | jq '.items[] | select(.spec.hubId == "my-hub")'

# Find Nodes created from this Form (the form name lives on spec.templateRef)
kubectl get lynqnodes -A -o json | jq '.items[] | select(.spec.templateRef == "my-form") | .metadata.name'To answer "What Forms are connected to this Hub, and what Nodes were created from them?" requires three commands.
Finding Problematic Nodes
Finding problems among 200+ Nodes was also tedious.
bash
# Method 1: Visual scan
kubectl get lynqnodes -A -o wide
# Check Ready, Desired, Failed columns one by one...

# Method 2: Filter with jq
kubectl get lynqnodes -A -o json | jq '.items[] | select(.status.conditions[] | select(.type == "Ready" and .status == "False"))'

# Method 3: Check in Grafana
# Run lynqnode_resources_failed > 0 query...Grafana works, but it felt like overkill just to check "what's broken right now?"
Limitations of Kubernetes Dashboard and Lens
General-purpose tools have limitations too. In Kubernetes Dashboard, Lynq CRDs are buried deep in the Custom Resources menu, which is cumbersome to navigate. Lens is better, but it doesn't show Hub-Form-Node relationships. They're just separate resource lists.
Features
Topology View
The most needed feature was seeing Hub-Form-Node relationships as a tree.
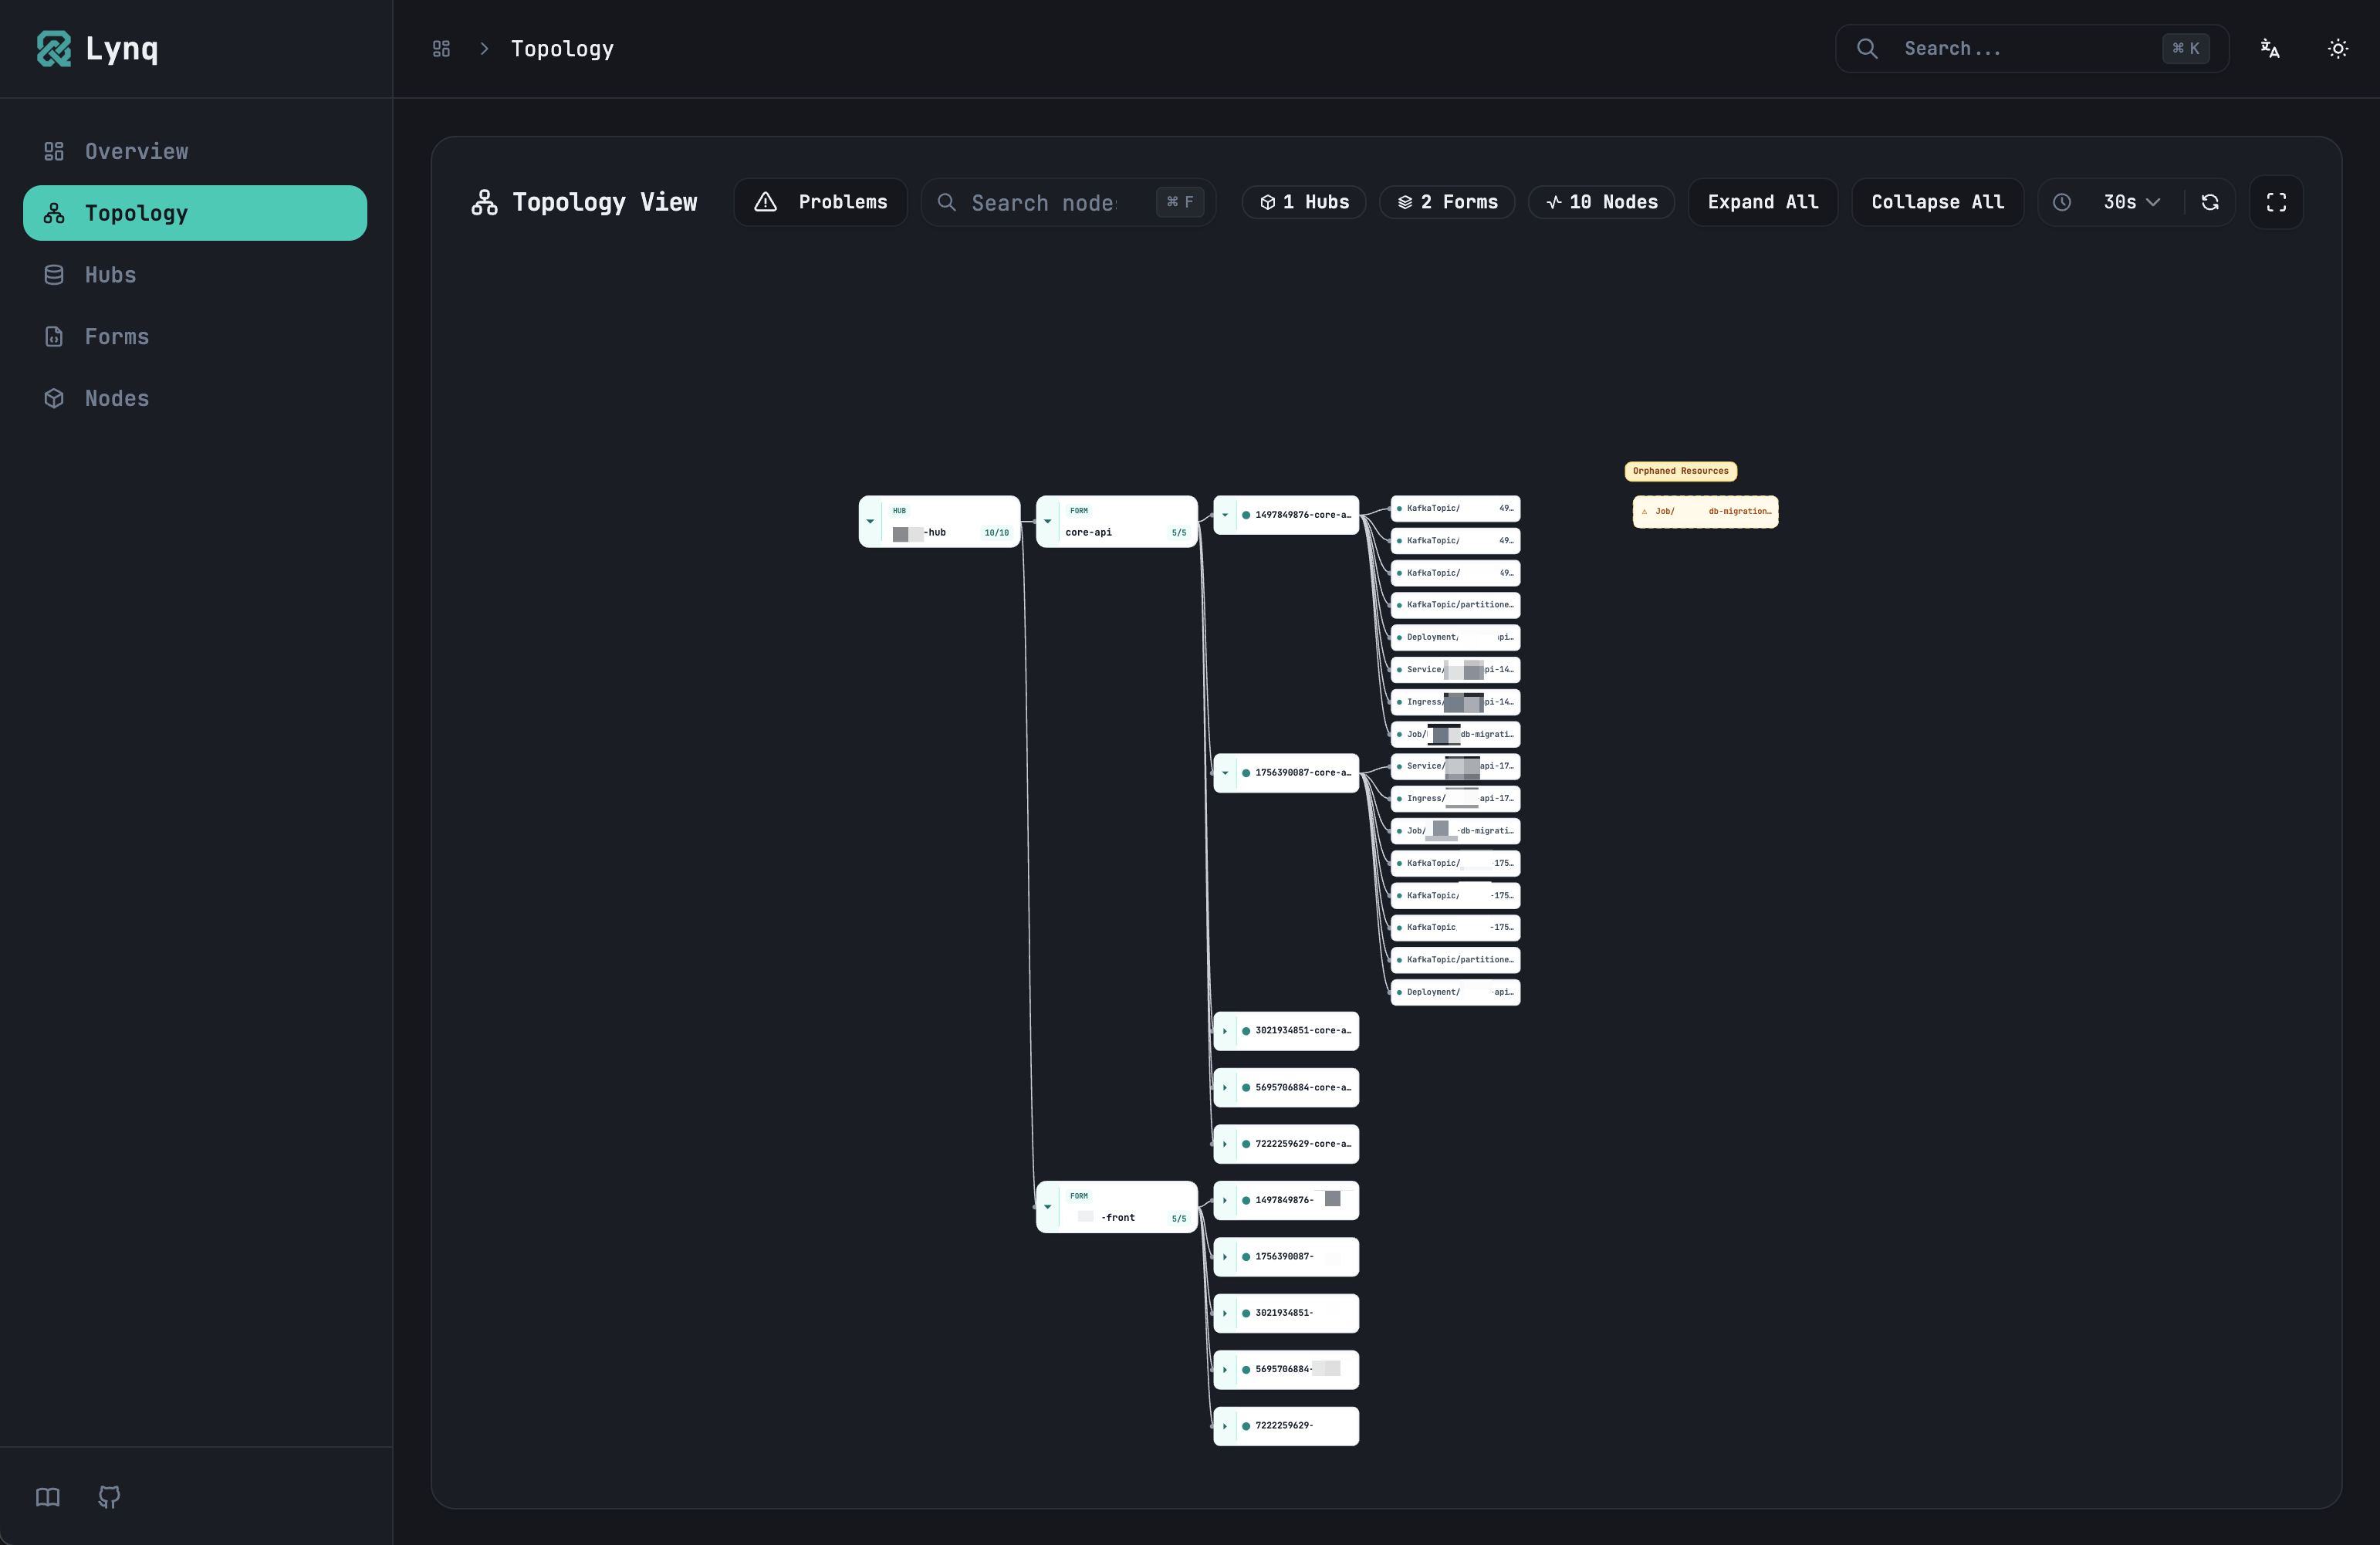
LynqHub: production-mysql
├── LynqForm: web-app
│   ├── LynqNode: customer-1-web-app ✓
│   ├── LynqNode: customer-2-web-app ✓
│   └── LynqNode: customer-3-web-app ✗ Failed
└── LynqForm: worker
    ├── LynqNode: customer-1-worker ✓
└── LynqNode: customer-2-worker ✓Now you can check "What's connected to this Hub?" with a few clicks.
Problem Mode
When 3 out of 200 Nodes have problems, there's no need to see the other 197.
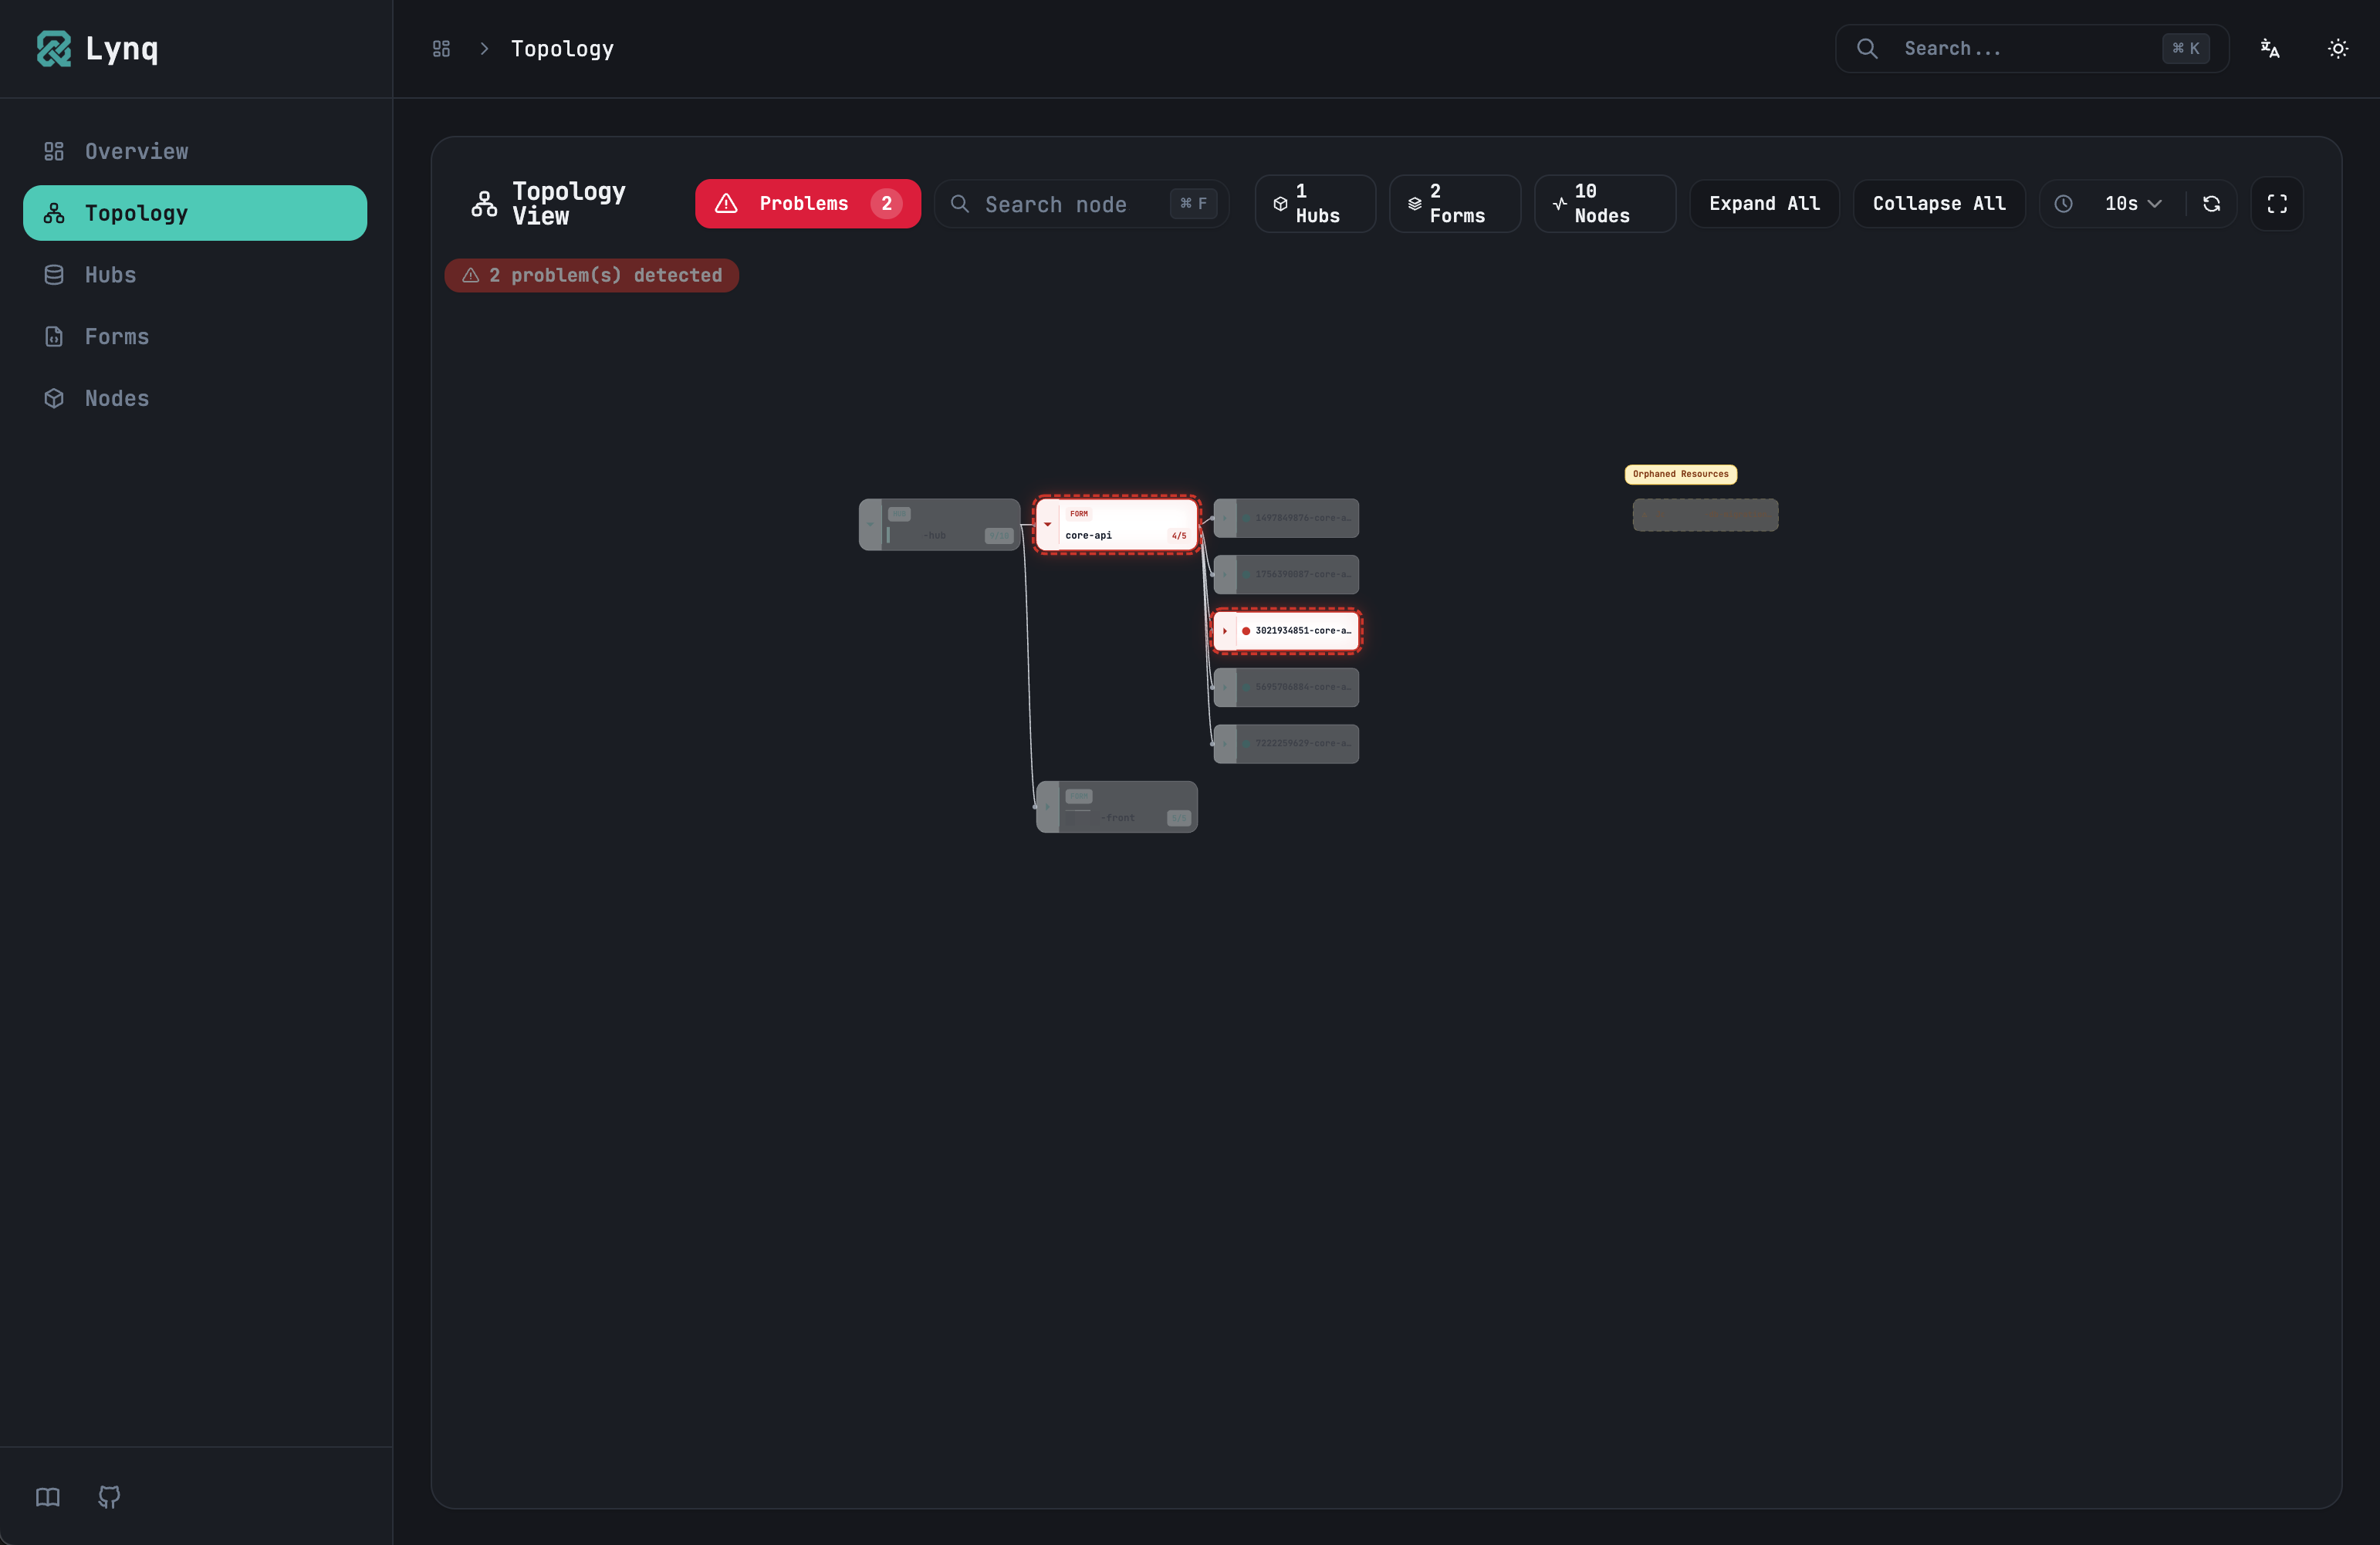
When Problem Mode is on, only failed Nodes are shown, and the tree automatically expands to show the parent Hub and Form. Problem counts are also shown as badges.
Without kubectl + jq or Grafana, just opening the dashboard shows "what's broken right now."
Overview
A page that summarizes the overall status.
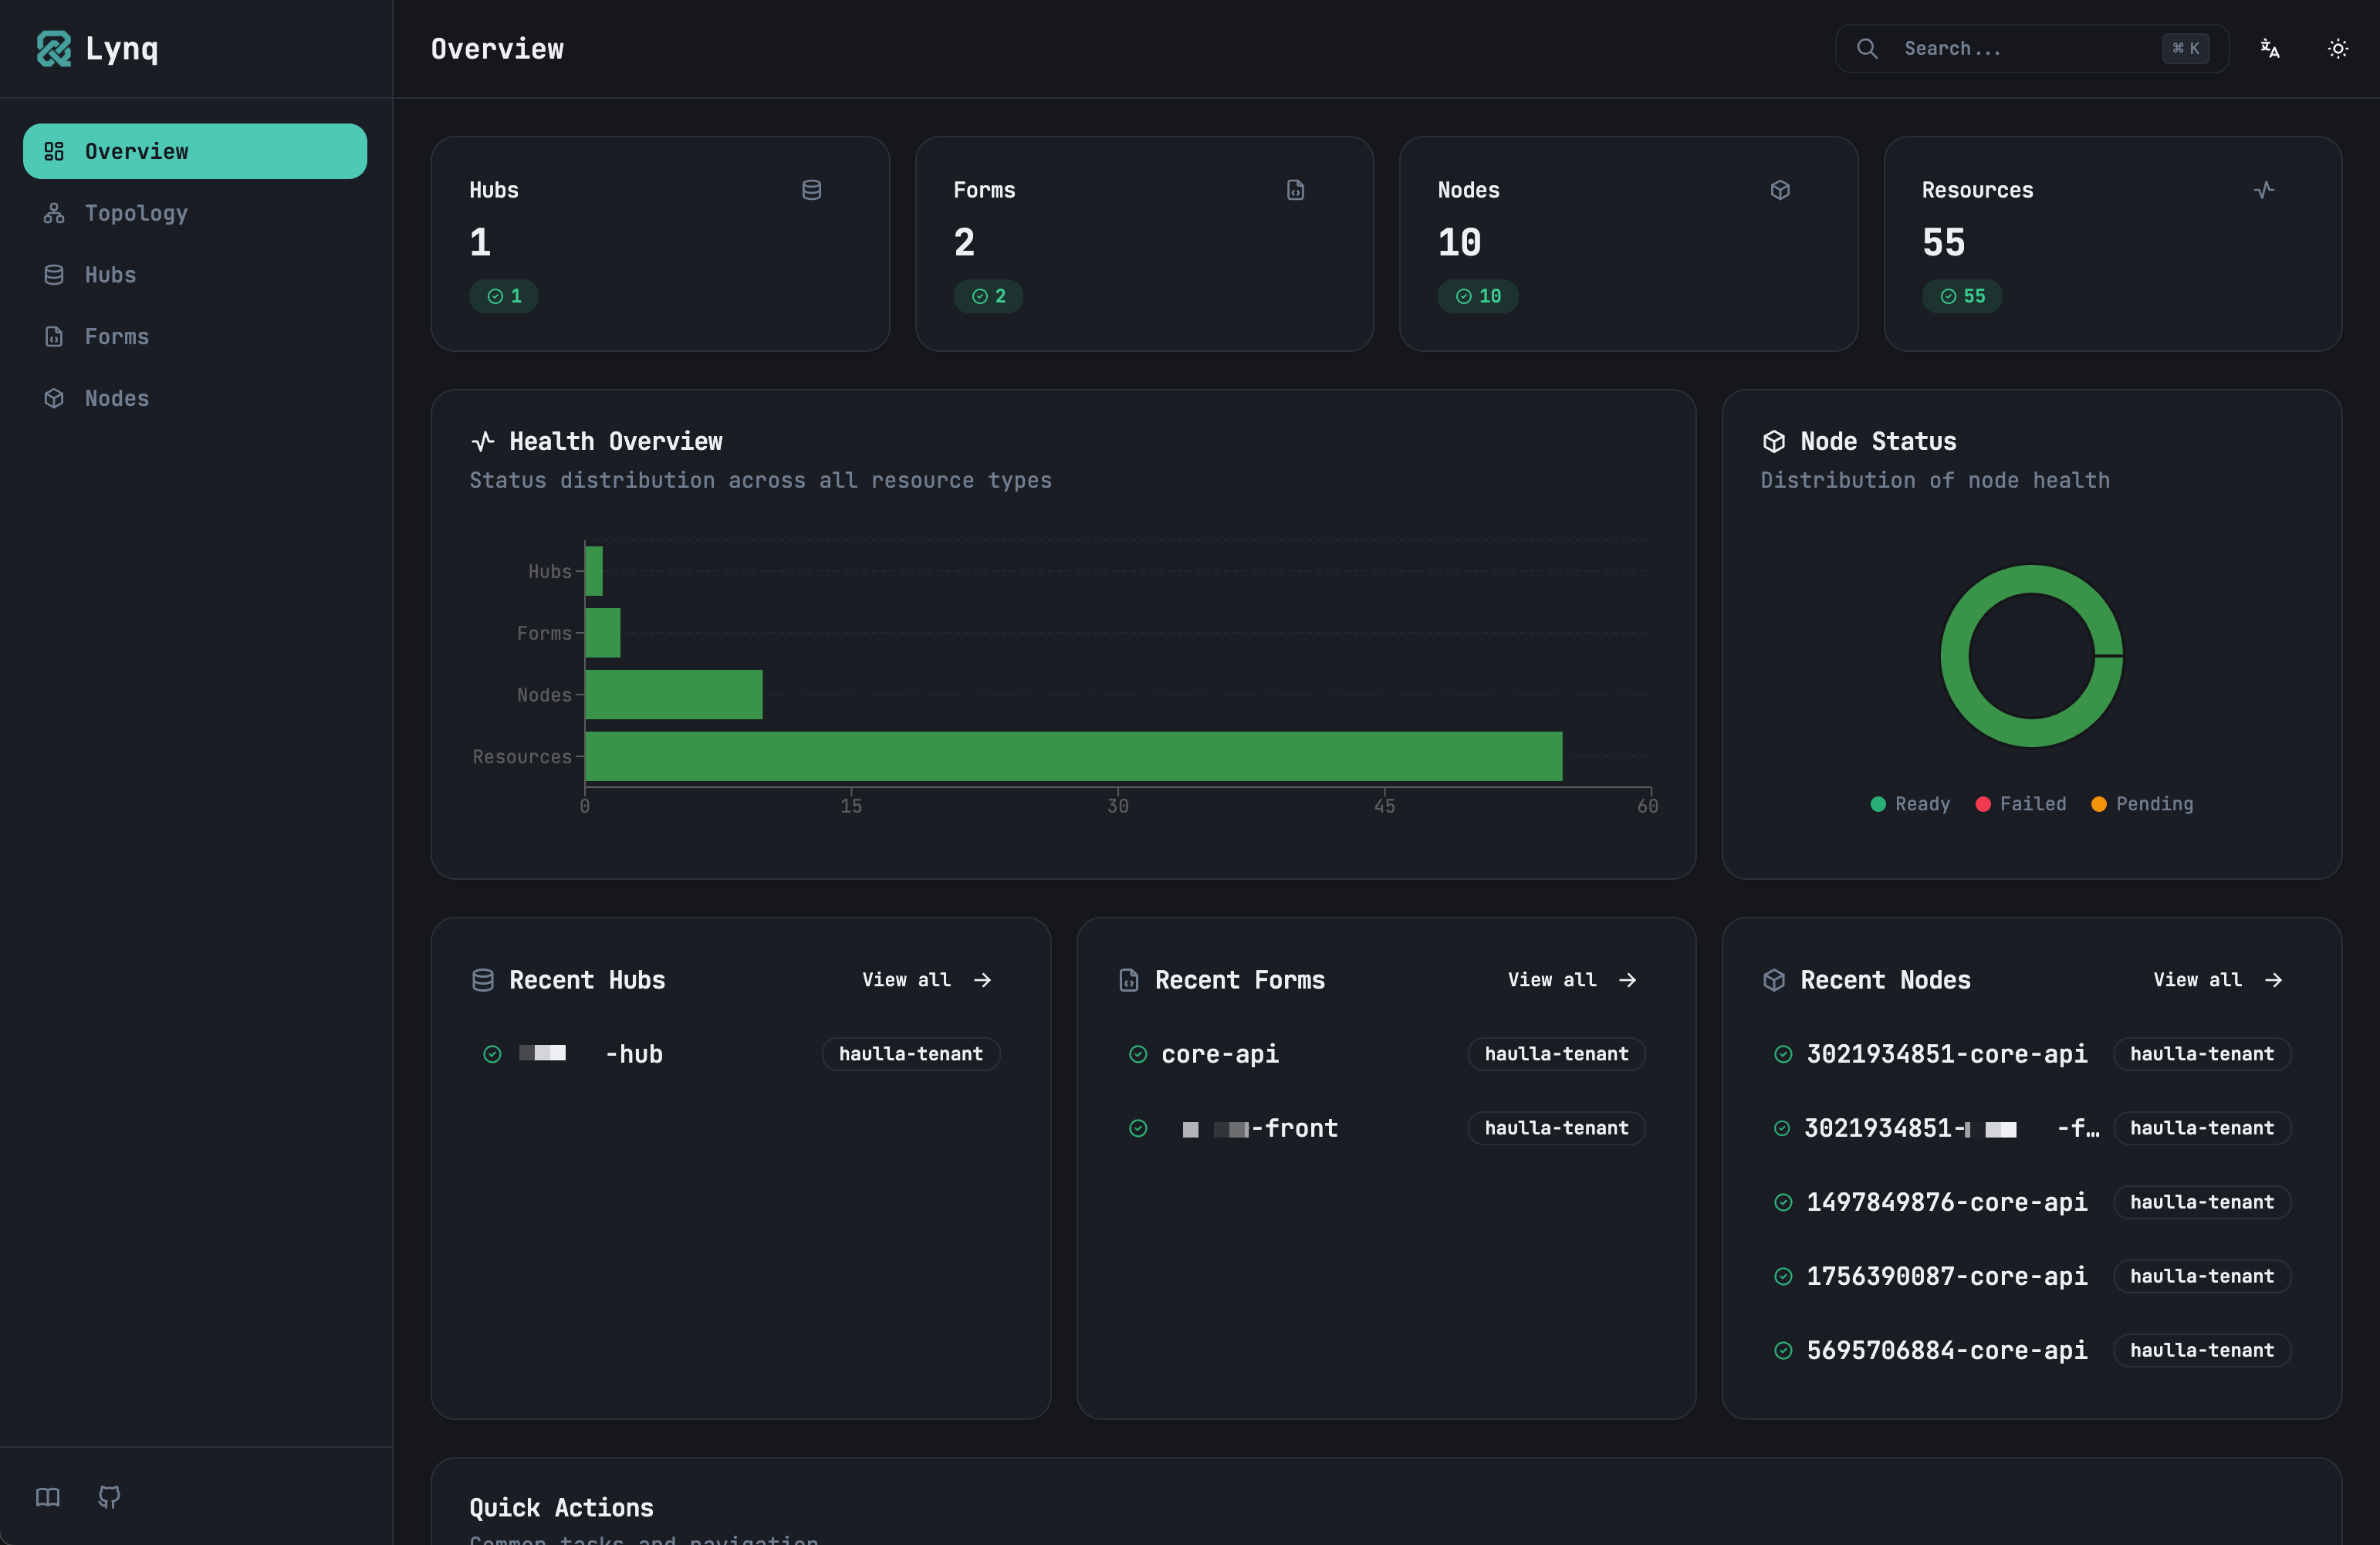
- Hub, Form, Node counts and states (Ready/Failed/Pending)
- Status distribution charts by resource type
- Recently created items list
For checking "What's the current state of Lynq in the cluster?"
Detail Pages
Click on any resource to see detailed information.
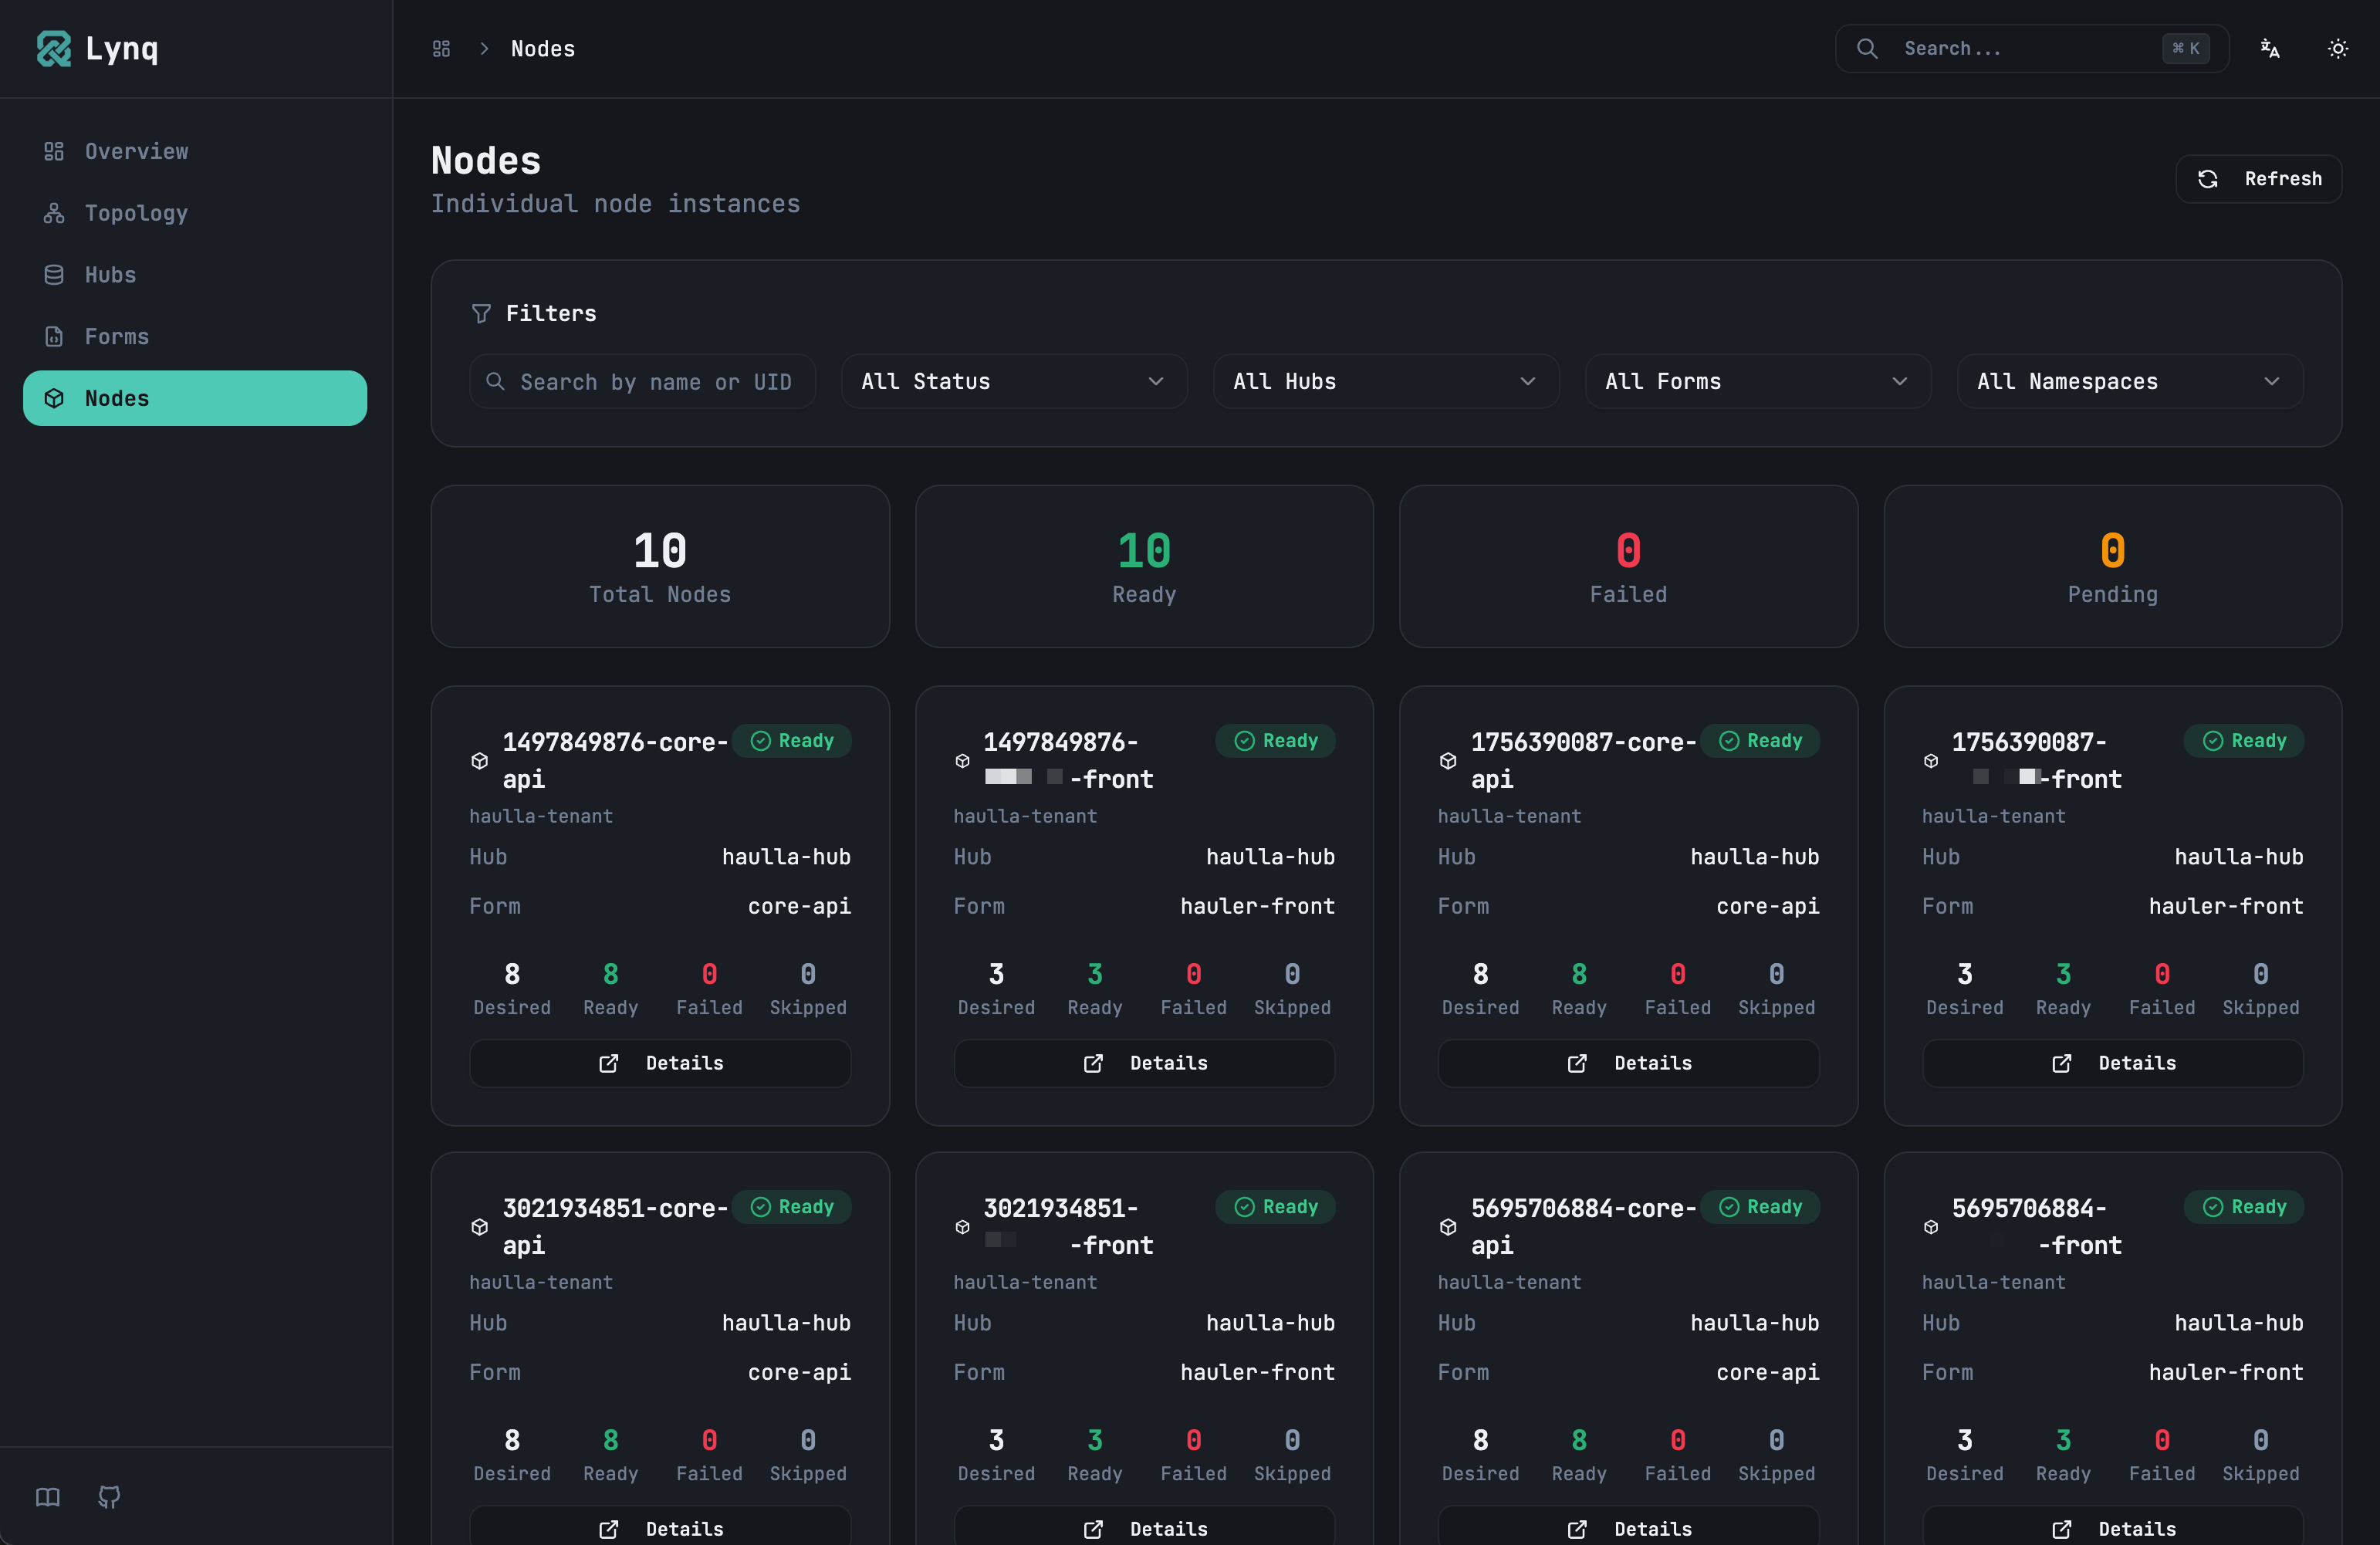
On the LynqNode detail page:
- Conditions (Ready, Degraded, etc.)
- List of resources managed by this Node and their states
- Kubernetes events
- Raw YAML
No need to run multiple commands to check "Why did this Node fail?"
Search
⌘+K for global search, ⌘+F for topology search. Found nodes automatically expand in the tree.
Others
- Dark mode / Light mode
- Korean / English support
- Auto-refresh every 30 seconds (adjustable)
Technical Details
BFF Server
Instead of calling the Kubernetes API directly from the browser, it goes through a BFF server written in Go.
[Browser] <-> [BFF Server (Go)] <-> [Kubernetes API Server]This way, kubeconfig doesn't need to be exposed to the browser, and Hub-Form-Node relationship calculations can be done on the server.
Currently it's read-only. In the future, we plan to share the same template engine as the Operator to add simulation and editing features.
Frontend
React + Vite + shadcn/ui. Charts use Recharts.
Polling vs WebSocket
Real-time updates weren't critical, so 30-second polling was sufficient. Implementing WebSocket watch would add complexity without proportional benefit.
Getting Started
You can run it immediately with Docker:
bash
docker run -d \
  -p 8080:8080 \
  -v ~/.kube/config:/root/.kube/config:ro \
  -e APP_MODE=local \
ghcr.io/k8s-lynq/lynq-dashboard:latestThen access http://localhost:8080.
For deploying to Kubernetes, see the Dashboard Installation Guide.
What's Next
Currently it only has "viewing" features. Planned additions:
- Hub, Form YAML editing
- Manual Node reconciliation trigger
- Multi-cluster support
- Template simulation (preview results before saving)
For feedback or feature suggestions, please leave them at GitHub Issues.
Try It Yourself
Want to give it a spin? We've prepared a hands-on demo on Killercoda. Try the Lynq Quickstart to see how adding and removing database records automatically provisions Deployments, Services, and Ingresses.